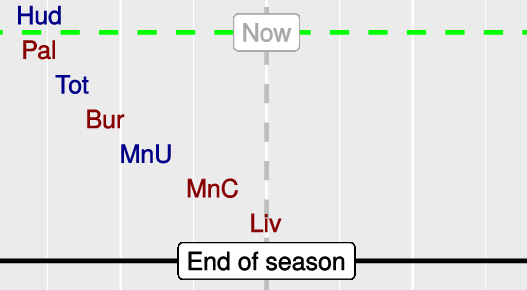
Some of the stories from the 2017–18 Premier League season
With the 2017–18 Premier League season now all finished, the alt-3 table shows perfect agreement with the official league table — exactly as it should do, by design! (The alt-3 method adjusts only for schedule-strength differences; and at the end of the season such differences are completely absent.)
The schedule strength chart for each club can still tell an interesting story, though. Below I will just pick out three such stories. Quick summaries are:
- Brighton defied expectations to overcome an exceptionally hard run-in to the end of the season;
- Everton sacked two managers, and even after taking account of the team’s tough fixtures under Ronald Koeman it’s clear that Sam Allardyce did better;
- Southampton’s match results were actually better in the second half-season (despite the fact that the Saints were 13th in the official league table at Christmas, but finished the season in 17th place).
Brighton
In this earlier post on April 9th, with 6 matches still to play it was notable that Brighton faced a formidable set of fixtures up to the end of the season. Here is how their schedule-strength chart looked, at that point:

I commented on April 9th that the away match at Crystal Palace looked like a “must win” match for Brighton, given their tough remaining fixtures after that.
In the event though, Brighton lost against Crystal Palace. But although they had flunked what had looked to be the easiest of their last 6 matches of the season, Brighton went on to gain even more than the necessary points for Premier League survival, through a remarkable trio of results — draws with Spurs and Burnley, and a win over Manchester United.
All of which amply demonstrates just how gloriously unpredictable football can be!
Everton
Much of my early-season commentary on the alt-3 table was about Everton, whose fixture list had pitched them against a string of top opponents in those first few weeks.
In this post on October 22nd, after all clubs had played 9 matches, it was notable that although Everton were placed 18th in the official league table, their true standing at that point was 12th (i.e., in the alt-3 table which takes proper account of schedule strength). The next day, Everton sacked their manager Ronald Koeman. (Koeman is now coach of the Netherlands national team.)
When Sam Allardyce took over as the club’s new manager, five weeks later, he inherited a rather easier set of fixtures up to the halfway point of Everton’s season. Through the lens of alt-3, we can now measure accurately the relative success of Everton managers Koeman and Allardyce in the 2017–18 season.
Everton’s alt-3 schedule-strength total for the first 9 matches of the season is +1.65 league points — i.e., 1.65 points should be added to Everton’s official points total on October 22nd, to adjust correctly for their relatively tough fixture list in the first 9 matches. (Actually, as things stood on October 22nd after the home match against Arsenal, Everton’s reported schedule strength rating was +1.9, which is slightly different from the +1.65 figure just quoted. The difference comes from the fact that we now have the full season’s Premier League results rather than just the first 9 matches.) The +1.65 figure comes from the relevant point — i.e., the home match with Arsenal at matchweek 9 — in Everton’s final schedule-strength chart, as computed at the end of the season:

What this means is that Everton under Ronald Koeman had effectively earned 1.65 points more, after 9 matches played, than their official tally of 8 league points. So Koeman’s effective points-per-match rate was \((8 + 1.65)/9 = 1.07\).
On the flip side, Sam Allardyce’s accumulated points total of 34 from his 24 matches in charge needs to be reduced by 0.75 points, to take account of Everton’s easier fixture list from that point on. (Allardyce took over as manager after the home match against West Ham, and the figure of 0.75 again comes from the relevant point in above schedule-strength chart.) So Big Sam’s effective points per match rate was \((34 - 0.75)/24 = 1.39\).
So Sam Allardyce did produce appreciably better results for Everton than Ronald Koeman’s, even after allowing for the fact that Allardyce’s team played easier fixtures than they had played under Koeman.
(But that did not prevent Everton from sacking Allardyce, too, at the end of the season!)
Southampton
Southampton started the season with relatively “easy” fixtures (matches at home against Swansea and West Ham) — and then remarkably, for the entire season, never had an easier schedule ahead of them than the matches they had already played. That is to say, in their schedule-strength graph the Saints stayed to the left of the centre-line, right up until the last day of the season.

Southampton had the easiest first half-season of any club, by some distance. They made 19 points from those first 19 matches (11 of which were played at home) — but really that was worth only around 17 points once fixture difficulty is taken into account. See the “Grueltide” post for more details if interested.
So the Saints’ season-end tally of 36 points came from, in effect, 19 points in the second half of the season — so a better second half-season than first half, even though they were 13th in the official league table at Christmas and 17th by the end. (In the alt-3 table, which takes schedule strength properly into account, Southampton were placed 15th at Christmas).
